


Reconstructing Distance Relay Curves directly from XRIO
Removing Dependencies on Proprietary Test Templates
Protection engineers during substation commissioning have traditionally relied on closed, device-specific software templates to test numerical distance relays. This dependency often prevents using a multi-vendor 3-phase relay testing kit if a particular template library is unavailable on site. However, modern numerical relays export all their final reach settings, line angles, and supervision values in standardized, open XRIO files. We present a case study proving that by extracting these settings directly and using basic analytical math, engineers can reconstruct and verify the correct distance characteristics, completely removing the dependency on proprietary templates.
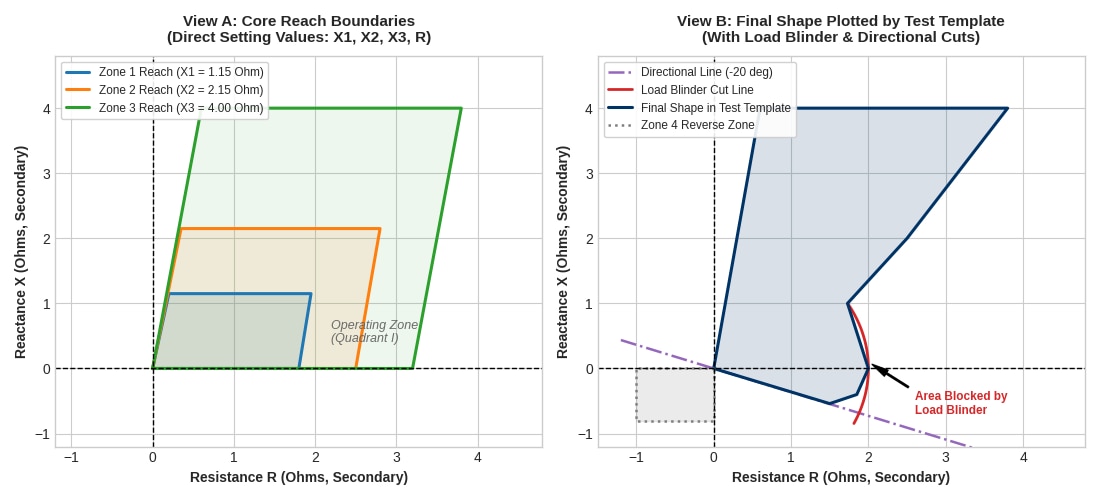 Figure 1: Comparison of distance protection characteristics. Left (View A): Pure reach boundaries (Zone 1, Zone 2, Zone 3) calculated directly from the relay setting values. Right (View B): Final shape generated by an automated test template showing directional cuts and the area blocked by the load blinder.
Understanding the Raw Setting Parameters Inside XRIO
When commissioning engineers evaluate distance relays, proprietary software templates give the impression that modern numerical relays require complex, vendor-locked algorithms to draw their operating curves. In reality, all numerical relays calculate fault impedance using fundamental electrical values: positive sequence reach, line replica angle, and resistive blinders. When an engineer exports a setting file in the open XRIO format, these values are stored as standard numerical registers.
For phase-to-phase faults, the forward reach is defined by the reactive reach (X1, X2, X3) and the resistive blinder (Rph). For phase-to-earth faults, the relay accounts for the zero-sequence earth return path using the residual compensation factor, commonly labelled as K0 or the ratio of earth-to-phase impedance (RE/RL, XE/XL). Rather than waiting for a software template to interpret these values, an engineer can read these numbers directly from the file to calculate the exact boundary coordinates.
Formulating Boundary Lines Using Simple Coordinate Geometry
To plot a distance protection zone into any universal secondary injection test kit, an engineer only needs to convert the setting registers into standard straight-line equations:
a ·R + b·X + c = 0
Here, R represents the resistance on the horizontal axis and X represents the reactance on the vertical axis. A basic quadrilateral zone is formed by four straight boundaries:
Top Reactance Line: A horizontal line set at the zone reach (X1, X2, or X3). The equation is simply 0·R - 1·X + Xreach = 0.
Right Resistive Blinder: An inclined boundary set at the transmission line impedance angle (typically 80° to 85°). For an 80° line angle and a resistance setting of 3.26 Ohms, the slope factor tan(80°) equals 5.671, giving the line equation 5.671·R - 1·X - 18.488 = 0.
Left Boundary: An origin line starting from zero and following the line angle.
Bottom Directional Line: A line tilted into the negative region (typically -15° to -20°) that ensures forward fault operation while blocking reverse faults.
By calculating where these straight lines cross each other, the test kit determines the exact corner points of the quadrilateral without needing any automated template software.
Practical Debugging: Correcting Curve Editor Errors on Site
Entering these lines manually into a generic curve editor provides valuable insight into how boundary geometry works, as demonstrated during the testing of a Siemens SIPROTEC 7SD522 relay.
In the first attempt to plot the forward resistance boundary (R = 3.26 Ohms at an 80° line angle), entering the slope angle without quadrant constraints produced an unwanted parallel line pointing in the opposite direction along a 260° angle. While the forward line projected properly into Quadrant I, the unconstrained line cut backward into Quadrant II.
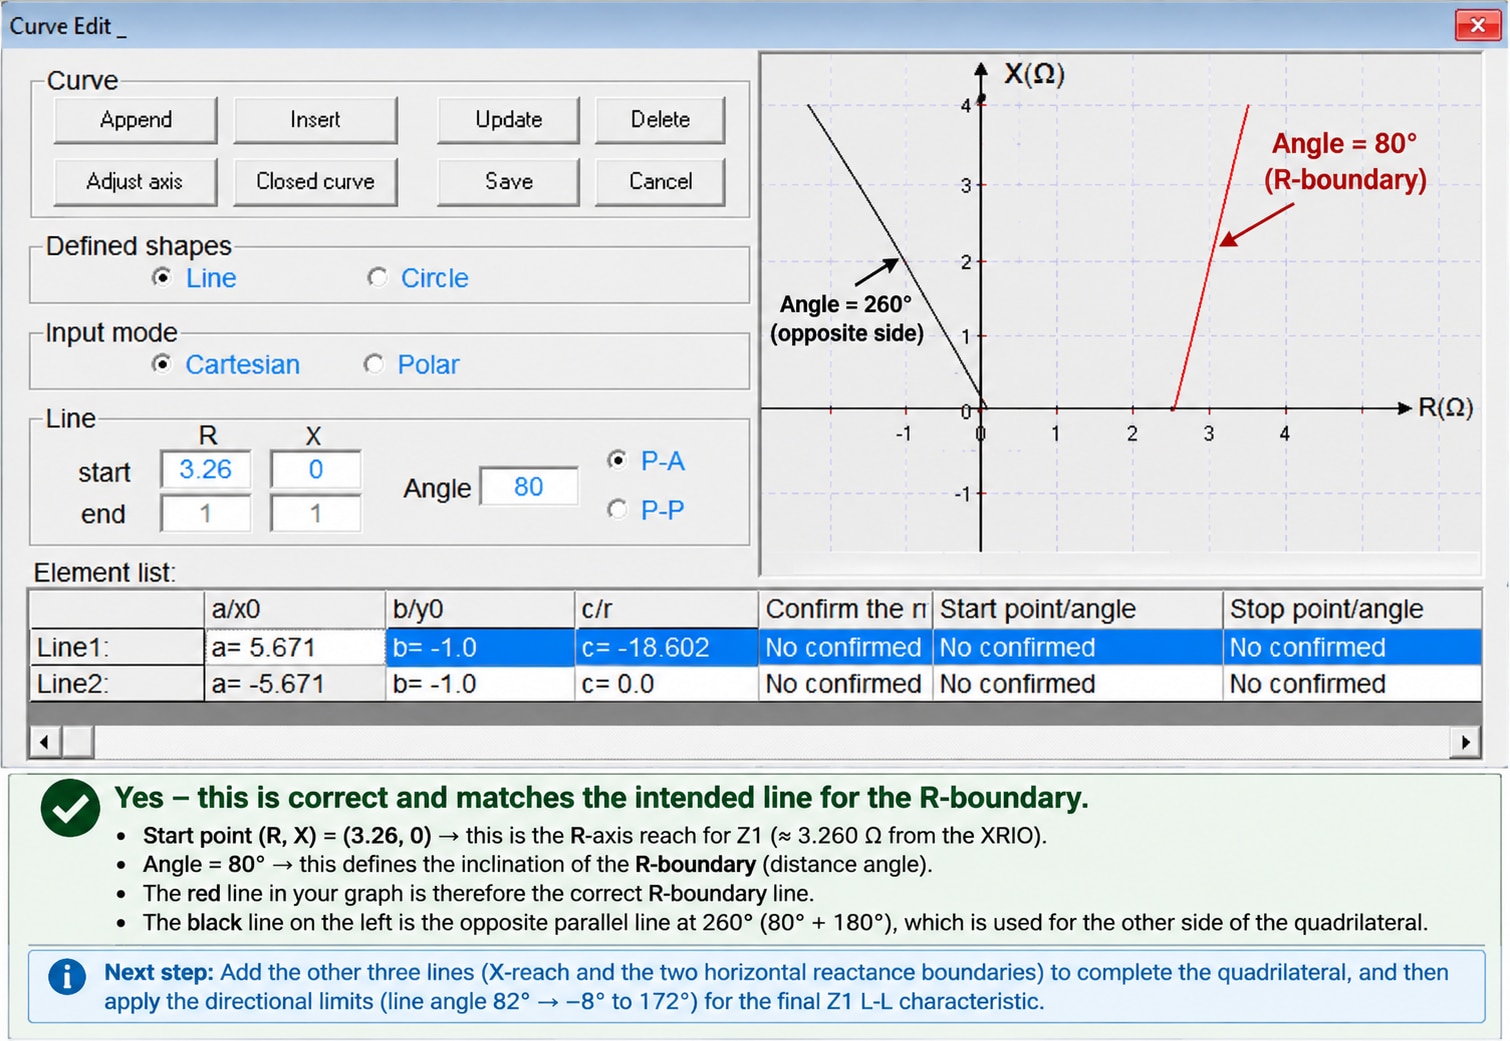
Figure 2: Initial entry of the forward resistance boundary showing the correct forward line alongside an inverted 260° line before quadrant limits were applied.
In the next step, entering the bottom directional cutoff using a negative slope (a = -0.364) without defining line start and end points caused the boundary to cut continuously through the origin into non-operating areas.
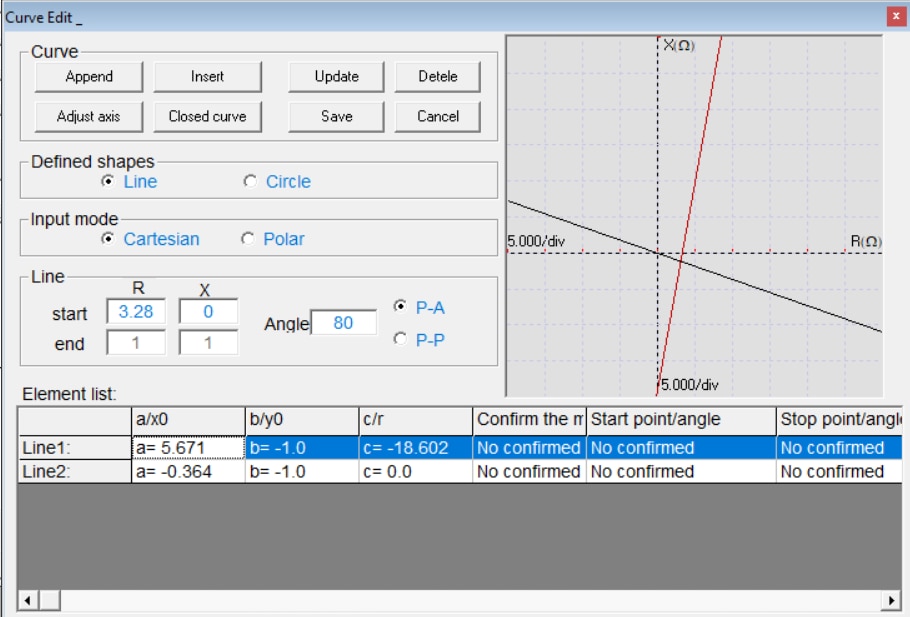
Figure 3: Adjusting the directional cutoff line against the forward boundary line.
Once each line was defined with proper start and end limits, the test canvas calculated the exact corner points:
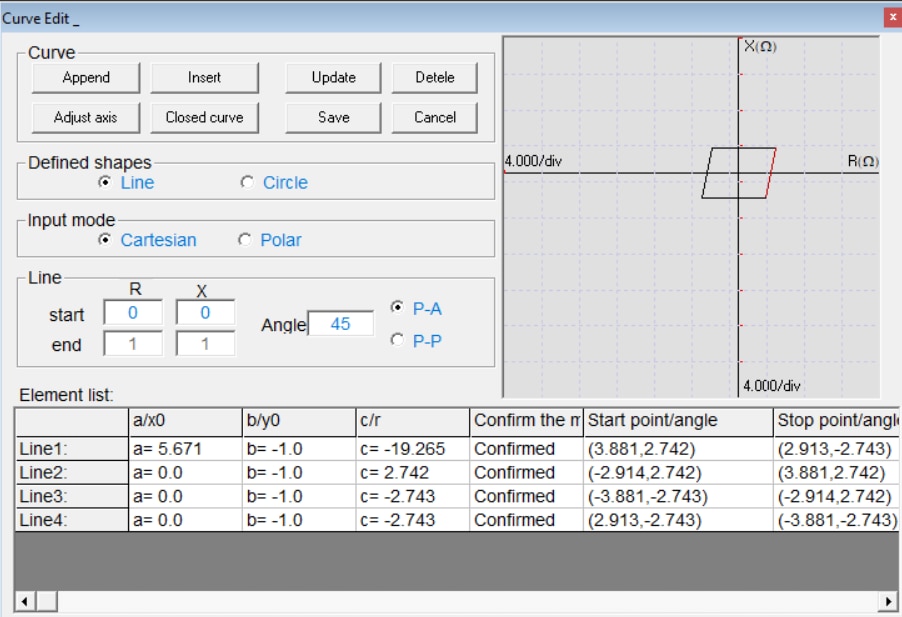
Figure 4: The completed, verified Zone 2 quadrilateral operating characteristic plotted using standard line equations in the generic curve editor.
Comparing Pure Reach Boundaries with Automated Template Shapes
When comparing the clean quadrilateral shapes plotted from direct setting values with the shapes generated by automated test templates for the exact same relay, field engineers often notice striking visual differences.
In automated testing environments, test sets use automated search rays that fire test shots from outside the polygon to find the exact boundary where the relay trips. If the relay has an active load blinder to prevent tripping under high load conditions, any test shot placed in that load region will naturally not trip. To prevent automated test routines from flagging a false test failure when search rays cross this region, automated software templates mathematically cut out the load blinder area from the operating shape.
The underlying reach values—top reactance (X) and forward resistance (R)—are identical in both methods. The visual difference occurs because the automated template shows the final net shape after cutting away the supervisory blinders and adding reverse backup zones.
Side-by-Side Comparison of MiCOM P544 and Siemens 7SD522
The table below explains why the final visual shapes differ between direct analytical extraction and automated test templates:
Protection Element | Direct Calculation Shape | Automated Test Template Shape | Practical Substation Reason |
MiCOM P544 Phase-to-Earth | Clean, upright quadrilateral extending to ground resistance reach (R = 4.54 Ohms). | Lens-shaped circular cutout on the right side in Quadrants I and IV. | The automated template cuts out the active load blinder so search rays do not fail on heavy load angles. |
MiCOM P544 Phase-to-Phase | Upright forward box reaching positive-sequence reactance (X = 14.25 Ohms). | The characteristic includes a bottom tilt cut and a reverse backup block in Quadrant III. | The automated template combines directional boundary lines and reverse Zone 4 into one single drawing. |
Siemens 7SD522 Phase-to-Earth | Forward quadrilateral scaled by residual earth factor settings. | Wide horizontal profile with a reverse tail extending into negative resistance. | Siemens distance protection uses an active reverse earth blinder, which the automated template draws across Quadrants II and III. |
Siemens 7SD522 Phas-Phase | Symmetrical quadrilateral bounded by forward resistive reach. | Inclined trapezoid anchored firmly to the transmission line replica angle. | Siemens phase distance elements use the line impedance angle as the left operating boundary rather than zero resistance. |
Commissioning Best Practices: Two-Stage Testing vs Automated Boundary Tracing
The comparison between pure reach boundaries and template-generated shapes brings out an important question for testing engineers at site: which testing methodology provides higher confidence during substation commissioning?
In automated boundary tracing, the test kit sweeps test shots along the perimeter of the composite shape. While this quickly confirms the outer trip boundary, it leaves supervisory functions unverified because the automated sweep purposely avoids shooting inside the cut-out load blinder.
A more rigorous commissioning approach is two-stage verification:
Stage 1 (Reach Accuracy): Verify the basic distance comparator by injecting test points near the nominal reach boundaries (X1, X2, X3, and R). This confirms that the internal impedance calculation and zone timing circuits are operating accurately according to setting values.
Stage 2 (Supervisory Blinder Restraint): Inject dedicated test shots directly inside the load encroachment region at normal operating current levels. The relay must remain stable and block tripping, proving that heavy power flow will not cause an unwanted line outage.
Stage 3 (Directional Discrimination): Inject test points in Quadrant III (-R, -X) for forward-configured zones. The relay must restrain from tripping, verifying directional security for reverse busbar or transformer faults.
By testing the primary reach and the supervisory blinders separately, testing engineers ensure both tripping dependability for in-zone faults and restraint security during severe system disturbances.
Conclusion: Achieving Testing Independence in Substation Commissioning
This practical evaluation shows that distance protection characteristics can be reconstructed and verified directly from raw XRIO setting files without proprietary software templates.
Key takeaways for commissioning teams include:
The fundamental reach limits (top reactance and forward resistance) calculated by direct line equations match the reach settings in manufacturer templates.
Differences in visual shape are caused by secondary supervisory functions, including load encroachment cutouts, reverse backup zones, and directional cutoff lines.
Understanding direct coordinate geometry enables testing engineers to commission numerical relays across multiple manufacturers using any universal 3-phase relay testing kit.
Breaking reliance on proprietary test templates avoids site delays, reduces software costs, and gives testing teams complete technical control during protection commissioning.
Related Technical Guides & Secondary Injection Equipment
• Technical Article: Why Some XRIO Files Generate Relay Characteristics and Others Do Not
• Product Guide: Universal 3-Phase Relay Testing Kit (MPF300) for Numerical Distance Protection
